Crown Prosecution Service Gender pay gap report for year ending March 2020
- Introduction
- Gender Pay Gap summary
- Gender Pay Gap, Equal Pay, Diversity and Inclusion approach
- Gender make-up of the CPS
- Gender Pay Gap
- Bonus Gender Pay Gap
- Pay Quartiles
- Work on eradicating the gender pay gap
- Declaration
Introduction
Gender Pay Gap (GPG) legislation introduced in 2017 requires all employers with 250 employees or more to report annually on their gender pay gap. Government departments are covered by the Equality Act 2010 (Specific Duties and Public Authorities) Regulations 2017 which came into force on 31 March 2017. These regulations underpin the Public Sector Equality Duty and require the relevant organisations to publish their gender pay gap data by 30 March annually.
The gender pay gap shows the difference in the average hourly pay between all men and women in a workforce. If a workforce has a particularly high gender pay gap, there may be specific issues that have given rise to this and the individual calculations may help to identify where those issues are.
Starting this year, the Cabinet Office Analysis and Insights Team are responsible for assessing gender pay gap figures for each department in the Civil Service. These are available at https://www.gov.uk/government/statistics/civil-service-statistics-2020 (Table C).
Gender Pay Gap summary
The Gender Pay Gap figures for 2020 are summarised below alongside those for 2018 and 2019 for comparison:
| Gender Pay Gap metric | 2020 | 2019 | 2018 |
|---|---|---|---|
| Mean gender pay gap in hourly pay | 11.7% | 9.40% | 9.30% |
| Median gender pay gap in hourly pay | 20.1% | 24.2% | 24.3% |
| Mean bonus gender pay gap | -1.20% | -19.0% | 29.0% |
| Median bonus gender pay gap | 0.0% | 0.0% | 0.0% |
| Proportion of males and females receiving a bonus payment |
Male: 33.2% Female: 32.7% |
Male: 24.8% Female: 23.0% |
Male: 23.3% Female: 23.0% |
| Proportion of males and females in each pay quartile | |||
|---|---|---|---|
| 2020 | 2019 | 2018 | |
| Lower quartile |
Male: 26.7% Female: 73.3% |
Male: 29.5% Female: 70.5% |
Male: 30% Female: 70% |
| Lower middle quartile |
Male: 30.4% Female: 69.6% |
Male: 30.3% Female: 69.7% |
Male: 30.5% Female: 69.5% |
| Upper middle quartile |
Male: 35.1% Female: 64.9% |
Male: 38.3% Female: 61.7% |
Male: 38% Female: 62% |
| Upper quartile |
Male: 43.7% Female: 56.3% |
Male: 39.9% Female: 60.1% |
Male: 41.5% Female: 58.5% |
Gender Pay Gap, Equal Pay, Diversity and Inclusion approach
5. The gender pay gap is different to equal pay. Equal pay deals with the pay differences between men and women who carry out the same or similar jobs or work of equal value. It is unlawful to pay people unequally because of their gender.
6. Building a diverse and inclusive workforce that reflects the people we serve is one of the Civil Service’s top workforce priorities. Our collective aim is to make the Civil Service the UK’s most inclusive employer by 2020. Our Diversity & Inclusion Strategy outlines how we plan to achieve this. As well as initiatives such as the Civil Service Year of Inclusion and the annual Civil Service People Survey, the Civil Service is working with Chartered Institute of Personnel and Development to develop measures of inclusion (see: https://www.gov.uk/government/publications/civil-service-diversity-inclusion-dashboard/civil-service-diversity-and-inclusion-dashboard)
7. The CPS is proud to be recognised as having one of the most diverse workforces in the Civil Service and committed to creating an inclusive and respectful working environment for all our people, reflecting the communities we serve and drawing on their diverse perspectives to improve the services we deliver (see our Equality, Diversity and Inclusion Statement).
Gender make-up of the CPS
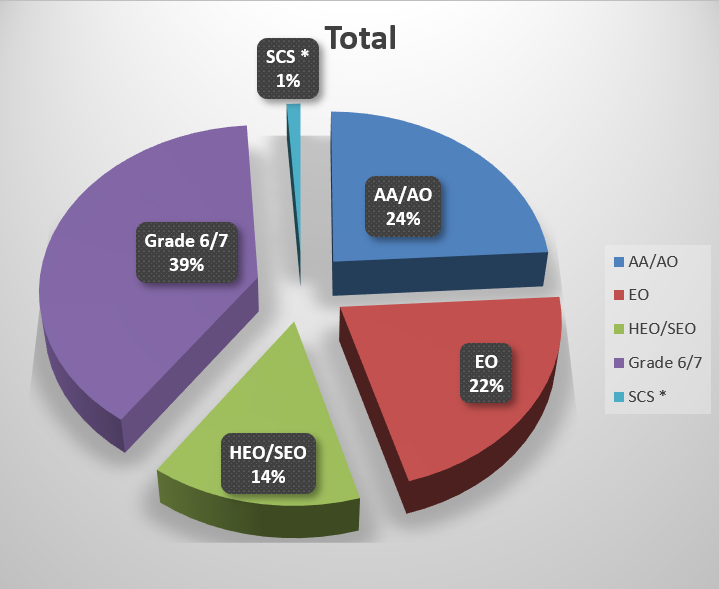
8. The composition of the CPS workforce by gender is shown in the table below which is illustrated using the standard Civil Service grade descriptions. The overall distribution remains broadly similar to that in previous years.
| Grade | No of females in grade | % of females in grade | No of males in grade | % of males in grade | Total in grade |
|---|---|---|---|---|---|
| AA/AO | 976 | 72.6% | 368 | 27.4% | 1344 |
| EO | 872 | 72.0% | 339 | 28.0% | 1211 |
| HEO/SEO | 578 | 65.7% | 302 | 34.3% | 880 |
| Grade 6/7 | 1587 | 60.3% | 1045 | 39.7% | 2632 |
| SCS * | 45 | 54.9% | 37 | 45.1% | 82 |
| Totals | 4058 | 66% | 2091 | 34% | 6149 |
*The CPS has a number of senior grades which are equivalent to the SCS. These have been included within this group
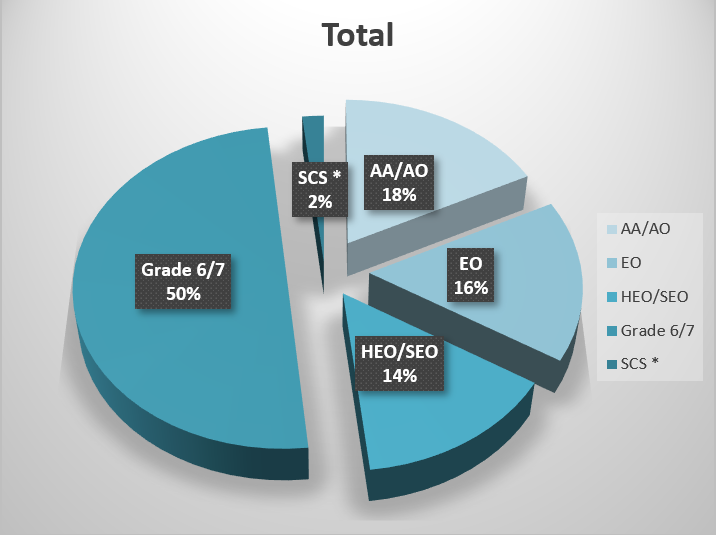
9. The following charts illustrate the composition of the workforce by gender for each Civil Service grade description. Similar to 2019, more women than men are employed in the lower grade/paid roles of AA/AO and EO, accounting for just over 30% of the overall workforce. However, there is a reduction of 0.7% in the proportion of women in these roles when compared to the previous year (and a smaller reduction of 0.5% for men in these positions). Conversely, in the middle to senior management grades (HEO to Grade 6) the proportion of women has increased by 1.2% whilst the proportion of men in these positions remained static.
Gender pay gap
10. The gender pay gap for the CPS is shown below, with the 2019 figures in brackets for comparison.
| Metric | Mean | Median |
|---|---|---|
| Gender pay gap | 11.7% (9.4%) | 20.1% (24.2%) |
11. We are not able to attribute the increase in the mean gender pay gap to one specific factor. Although the increase in the proportion of women in middle to senior management grades is positive news for the female workforce the overall female to male ratio for the organisation remains at 2:1 i.e. there are still twice as many women employed as men with 50% of the male workforce in the higher graded roles (Grade 6/7) compared to just under 40% for women. As such there is still a significant relatively negative impact on the mean and median gender pay gap. Additionally, employees new to a role will in the main join at the minimum of the pay range which means the increase in the female workforce proportion is offset by salaries positioned in the lower quartiles. When considered against the static proportionality of the male workforce this also impacts on the gender pay gap.
12. Although not the only contributing factor to a trend that has seen the median gender pay gap steadily reducing over the last three years, targeted structural pay reforms have played an important part in achieving this. As part of a longer-term pay strategy this has included significant reductions in several our lengthier pay ranges which has facilitated less of a variation in the way salaries are positioned along the range.
13. Our annual analysis of employee salaries on a grade-by-grade basis continues to show that men and women are paid broadly the same. Where variations exist, in the main this continues to be explained by differences in the length of time spent in the grade.
Bonus Gender Pay Gap
14. The Bonus Gender Pay Gap figures below comprise payments made to our employees in the Senior Civil Service (SCS) cadre (in line with Cabinet Office guidance) and payments made to employees in grades below the SCS under our corporate recognition scheme. The latter provides a flat rate £25 voucher to individuals for exceptional outcomes or for going beyond reasonable expectations. The bonus pay gap for 2019 is shown in brackets for comparison:
| Calculating Average | Mean | Median |
|---|---|---|
| Bonus Gender pay gap | -1.0% (29.0%) | 0.0% (0.0%) |
| Proportion of men receiving a bonus | 33.2% (24.8%) | 698 recipients (512) |
| Proportion of women receiving a bonus | 32.7% (23.0%) | 1337 recipients (914) |
15. The proportion of male and female employees who received a bonus for 2020 is broadly similar (a difference of 0.5%). There is a sizeable change to the mean bonus pay gap compared to 2019 albeit this is still attributed to the distribution of payments in the SCS cadre where individual payments are significantly higher than those made under the corporate recognition scheme. As before a larger number of women in the SCS cadre received a bonus payment compared to men. However, on this occasion the value of the individual payments across the genders were more closely clustered. Additionally, the ratio of payments between men and women in the SCS cadre was lower this year i.e. three times as many women as men received a bonus last year compared to twice as many women as men that received a bonus in 2020.
Pay Quartiles
16. The proportion of male and female employees in each quartile is as follows, with the 2019 figures in brackets for comparison.
| Lower quartile | Lower middle quartile | Upper middle quartile | Upper quartile | ||||
|---|---|---|---|---|---|---|---|
|
Men % |
Women % |
Men % | Women % |
Men % | Women % |
Men % | Women % |
| 26.7 (29.5) | 73.3 (70.5) | 30.4 (30.3) |
69.6 (69.7) |
35.1 (38.3) |
64.9 (61.7) | 43.7 (39.9) | 56.3 (60.1) |
17. The quartile analysis shows that women remain in the majority in each of the quartiles with a small increase in the proportion of women in the upper middle quartile. This represents an increase in the number of women within senior middle management.
Work on eradicating the gender pay gap
18. The gender ratio continues to remain at approximately 2:1 women to men, with 46% of the female workforce in our junior grades (AA to EO). Therefore, our efforts continue to centre on encouraging women into more senior/leadership roles through a variety of talent management and management development programmes, as well as identifying and eliminating any potential barriers to progression. These programmes remain open to our male employees but our overall longer-term aim is to encourage a transformational gender shift in the junior grades which will then start to narrow the mean and median gender pay gap.
19. The CPS compiles an Annual Equalities in Employment Report (AEER) which provides an overview of equality in employment through data provision and analysis. It enables the CPS to comply with its responsibilities under the Equality Act 2010 including identifying trends and patterns in relation to protected characteristic (such as gender) and other groups and making recommendations for improvement.
20. The AEER for 2020 does not identify any gender disproportion across CPS people practices. However, there continues to be an under-representation of women in our Crown Advocate grade (36%) which is considered to be disproportionate compared to the overall representation of women in the CPS. Embedding the principle that smarter working can be successfully combined with the demands of the role alongside work to identify and remove barriers that might be preventing women moving into such roles continues.
Recruitment, retaining and developing a diverse workforce
21. Recruitment campaigns run throughout the year and are either ‘internal’ exercises (ring-fenced to existing employees) or ‘external’ (open to existing employees, the wider civil service and the general public). During 2019/20 females accounted for almost 70% of the appointments from internal exercises. For the same period women accounted for 65% (up 14% from last year) of external appointments [CPS AEER 2020].
22. Name-anonymised recruitment remains our standard approach and female representation on interview and selection panels is mandatory.
Family friendly
23. The CPS is committed to providing smarter working arrangements for all employees, including access to a variety of working patterns. The CPS has a great track record of providing flexible working and has been recognised by working families as a top ten employer for the last four years. For the period of 2019/20 92% of those that worked part-time are women.
24. Looking to the future we plan to further enhance our smarter working practices in 2021, incorporating lessons learnt from the quick-succession adaptations made as a result of the Covid-19 pandemic. Additionally, we will look to identify those practices that provide optimum flexibility as well as productivity gains in line with our on-going business commitments.
25. This year CPS introduced a Carers Network and achieved Level 2 Carers Accreditation by Employers for Carers UK. This is a significant achievement, recognising our collective efforts to build an inclusive workplace where carers are recognised, respected and supported.
Career paths
26. With respect to talent management and development, there are a number of schemes (internal and cross-government) that the CPS runs/participates in. One such scheme - Leading for Success - has been designed to focus on next generation senior leaders within the CPS. This is a three-year programme with the most recent intake commencing in 2019 where 79% of participants were female. To date, 72% of those delegates have already gained either temporary or permanent promotions to senior leadership positions.
27. Further work is to be undertaken to identify and remove any barriers for female employees moving into more senior roles (including Crown Advocate roles) and to develop a positive action campaign which will attract more men into junior roles.
Pay systems
28. In 2020 we continued with a strategy started in previous years to shorten our pay ranges as we know that lengthy ranges have adversely impacted both the mean and median pay gap. This is an on-going initiative that we aim to progress and monitor for impact as we see a steady reduction in the median pay gap.
Declaration
29. The CPS confirms that the reported data is accurate and has been calculated according to the requirements and methodology set out in the Equality Act 2010 (Specific Duties and Public Authorities) Regulations 2017.
Dawn Brodrick
Chief People Officer
Crown Prosecution Service, December 2020