Crown Prosecution Service Gender Pay Gap Report for year ending March 2021
- Foreword by Chief People Officer Dawn Brodrick
- Background
- Gender Pay Gap summary
- Gender Pay Gap in relation to Equal Pay and Diversity & Inclusion
- Gender make-up of the CPS
- Gender Pay Gap
- Bonus Gender Pay Gap
- Pay Quartiles
- Work on narrowing the gender pay gap
- Declaration
Foreword
by Chief People Officer Dawn Brodrick
The gender pay gap is different from – but often confused with – equal pay.
The CPS is an organisation of equality, which values inclusivity and diversity. Ensuring our people are supported to develop and have the right tools and skills they need is a key aim in our organisational strategy CPS 2025. It is the law, and right, that people employed in an organisation are paid the same for like work regardless of their gender – that is equal pay.
Our gender pay gap figures are 11.3% (mean), and 28.3% (median). These figures represent the gender pay gap in hourly pay between men and women in the CPS.
There are reasons why this pay gap exists which I will set out here – and one of them is how well represented women are across the CPS.
Our workforce is 66% women. Of these, 45% are employed in more junior roles – this has the effect of bringing down the average hourly pay of women when compared to men.
As an employer, we appeal to women. During 2020/21 women accounted for almost 65% of all appointments. There are many reasons why we are an employer of choice. We have progressive employment policies, such as our forward-thinking approach to hybrid working, and we are a Top 10 Working Families accredited employer. We have a skilled and diverse workforce, attractive career, learning and development opportunities, and much more. Of course, these factors appeal to all people regardless of their gender identity.
In the more senior – and therefore higher paid – roles, we have a gender split of 60.4% women and 39.6% men, meaning we have more women than men in these positions. However, because there are, of course, fewer of these roles, the overall numbers are much lower meaning that it doesn’t have a big impact on the median gender pay gap calculation.
Away from the figures, our People Strategy reinforces our commitment to creating a workplace in which everyone can thrive. We are proud that the diversity of our workforce reflects the communities we serve, helping us to deliver justice.
Background
1. Gender Pay Gap (GPG) legislation introduced in 2017 requires all employers with 250 employees or more to report annually on their gender pay gap. Government departments are covered by the Equality Act 2010 (Specific Duties and Public Authorities) Regulations 2017 which underpin the Public Sector Equality Duty and requires the relevant organisations to publish their gender pay gap data by 30 March annually.
2. The gender pay gap shows the difference in the average hourly pay between all men and women in a workforce. If a workforce has a particularly high gender pay gap, there may be specific issues that have given rise to this and the individual calculations may help to identify where those issues are.
3. Since 2020 the Cabinet Office’s Analysis and Insights Team is responsible for collecting and assessing gender pay gap figures for each department across the Civil Service. This mandated arrangement ensures consistency in methodology when reporting across the civil service. Cabinet Office publish departmental GPG as part of the annual civil service workforce statistical release and 2021 pay gaps can be viewed at Civil Service statistics: 2021 - GOV.UK (www.gov.uk).
Gender Pay Gap Summary
4. CPS Gender Pay Gap figures for 2021 are summarised below in figure 1, alongside those for 2020 and 2019 for comparison. These show that both the mean and median gaps are increasing over the comparison period. This is not because of changes in salaries paid to men and women but is because of the high number of women employees and the concentration of women in the more junior/lower paid roles.
Figure 1
| Gender Pay Gap metric | 2021 | 2020 | 2019 |
|---|---|---|---|
| Mean gender pay gap in hourly pay | 11.3% | 11.7% | 9.4% |
| Median gender pay gap in hourly pay | 28.3% | 20.1% | 24.2% |
| Mean bonus gender pay gap | -16.2% | -1.2% | -19.0% |
| Median bonus gender pay gap | 0.0% | 0.0% | 0.0% |
| Proportion of males and females receiving a bonus payment |
Male: 41.3% Female: 39.3% |
Male: 33.2% Female: 32.7% |
Male: 24.2% Female: 23.0% |
5. Figure 2 shows the percentage distribution of male and female in pay quartiles. Our workforce gender composition, particularly with junior grades, means around 70% of employees’ hourly pay rates populating the lower and lower middle quartiles are female and this distribution is the principal cause behind the CPS’ gender pay gap.
Figure 2
Proportion of males and females in each pay quartile
| 2021 | 2020 | 2019 | |
|---|---|---|---|
| Lower quartile |
Male: 27.7% Female: 72.3% |
Male: 26.7% Female: 73.3% |
Male: 29.5% Female: 70.5% |
| Lower middle quartile |
Male: 29.5% Female: 70.5% |
Male: 30.4% Female: 69.6% |
Male: 30.3% Female: 69.7% |
| Upper middle quartile |
Male: 34.0% Female: 66.0% |
Male: 35.1% Female: 64.9% |
Male: 38.3% Female: 61.7% |
| Upper quartile |
Male: 43.2% Female: 56.8% |
Male: 43.7% Female: 56.3% |
Male: 39.9% Female: 60.1% |
Gender Pay Gap in relation to Equal Pay and Diversity & Inclusion
6. The CPS is proud of its diverse workforce. The department is committed to creating an inclusive and respectful working environment for all its people, reflecting the communities it serves and drawing on their diverse perspectives to
improve the services it delivers (see our Equality, Diversity and Inclusion statement).
7. The gender pay gap is different to equal pay. Equal pay deals with the pay differences between men and women who carry out the same or similar jobs or work of equal value. It is unlawful to pay people unequally because of their gender.
8. The Civil Service is at its best when it reflects the diversity of the population as a whole and is able to understand what the public needs. The Civil Service is committed to reflecting the country that it serves, and is taking targeted action to tackle underrepresentation, especially in the Senior Civil Service. As well as initiatives such as the Civil Service Year of Inclusion and the annual Civil Service People Survey, the Civil Service is working with the Chartered Institute of Personnel and Development to develop measures of inclusion (see section 2 of the Civil Service diversity and inclusion dashboard).
Gender make-up of the CPS
9. The composition of the CPS workforce is the main reason for the resulting mean and median gender pay gaps in CPS. The gender split by grade on 31 March 2021 is shown in the table below at figure 3, using standard Civil Service grading.
10. Although there has been year on year increases to the organisation’s headcount, the CPS’ gender split of 66.4% to 33.6% remains the longer-term pattern.
Figure 3
| Grade | Number of females in grade | % of females in grade | Number of males in grade | % of males in grade | Total in grade |
|---|---|---|---|---|---|
| AA/AO | 1064 | 73.4% | 385 | 26.6% | 1449 |
| EO | 974 | 72.1% | 376 | 27.9% | 1350 |
| HEO/SEO | 650 | 66.3% | 331 | 33.7% | 981 |
| Grade 6/7 | 1728 | 60.4% | 1133 | 39.6% | 2861 |
| SCS* | 49 | 59.0% | 34 | 41.0% | 83 |
| Totals | 4465 | 66.4% | 2259 | 33.6% | 6724 |
*The CPS has several senior grades which are equivalent to the SCS. These have been included within this group
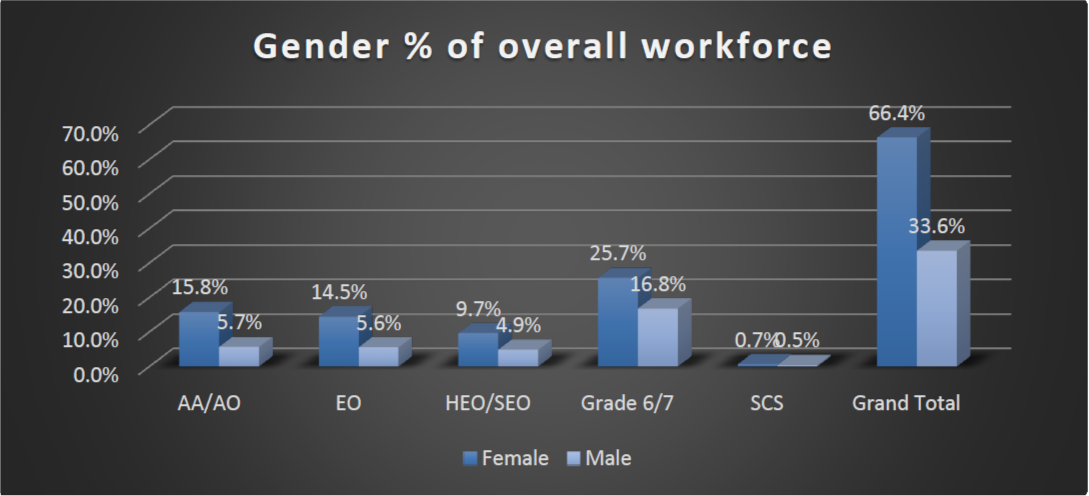
11. The column chart below at figure 4 shows the percentage breakdown of the workforce by gender and grade, illustrating the disproportionate numbers of women employed in junior grades/lower paid roles of AA/AO/EO. Women in these grades represent 30% of the total workforce whereas men in these grades make up only 11%. This difference in composition of the workforce impacts significantly on the CPS gender pay gap in a negative way.
Figure 4
12. Gender demographics for each grade remain broadly unchanged from previous years, however analysis shows that since the last GPG analysis in 2020 the female headcount increased by 407 (10.8%) in the junior and middle management grades (AA to SEO). This contrasts to a male headcount increase of 83 (8.2%) in these grades. Females in grades AA - SEO represent 60% of the women’s dataset. Men in these grades represents 48% of the men’s dataset. This difference affects the 2021 pay gap because new recruits in these grades exacerbate the already unbalanced gender ratio.
13. The position for Senior Civil Servants and equivalent grades is more positive. Although only a small group of 83 of the overall workforce, female representation within SCS grades increased to 59.0% (from 54.9% reported in 2020). This is above the Civil Service average of 46.7% (Source: 2021 CS Workforce Statistical Release).
Gender Pay Gap
14. Figure 5 shows the mean and median pay gaps for the CPS for the year 2021, with the figures for the year 2020 in brackets.
Figure 5
| Metric | Mean | Median |
|---|---|---|
| Gender pay gap 2021 | 11.3% (11.7%) | 28.3% (20.1%) |
Median pay gap
15. Pay gap reporting using the median measure is preferred across most of industry. The difference between the midpoints in each gender pay data set of hourly pay is felt to be more representative because the median is not affected by outliers at the top and bottom of each gender’s data set.
16. The CPS’ median measure of 28.3% shows the gap widening by 8.2%. Such a pay gap could indicate issues of pay disparity between women and men. However, GPG calculations do not factor for a workforce that is made up of 66% women, of which 45% are in junior grades on lower hourly pay. This is compared to a 34% male population of which only 33% are in junior grades. This combination of a heavily imbalanced gender split favouring women made up of disproportionately more numbers in junior grades results in a lower median hourly rate for women.
17. A gender pay analysis of the median for each grade has also been calculated. The median for each grade/group is considerably lower than the overall gender pay gap median of 28.3% and further illustrates the gender composition is skewing the organisation wide calculation.
Figure 6
| Median Gender Pay Gap by Grade/Group | |
|---|---|
| AA/AO | 0% |
| EO | 0% |
| HEO/SEO | -1.9% |
| Grade 7/6 | 4.2% |
| SCS | 9% |
18. Following further analysis, the 8.2 %-point increase in the median pay gap can be attributed to the recruitment outcomes over the 12 months. During this period more women were appointed into junior grades compared to men. Although the ratio of women to men for the workforce ratio shows a slight shift biasing towards women, the headcounts involved in both numbers recruited and of the overall female population has the effect of pushing down the median value of hourly pay for women. The reverse happens with the smaller male dataset with respectively lower headcount growth in junior grades. The values below show how the effect of 2020/21 recruitment of women and men have had on the median value for each dataset.
| Women Median Falls | Men Median Rises |
|---|---|
| £17.86 per hour in 2021 | £24.90 per hour in 2021 |
| £19.07 per hour in 2020 | £23.94 per hour in 2020 |
Mean Pay Gap
19. Similar to the median measure, the workforce headcount ratio of women to men is the reason for reporting an 11.3% mean pay gap. The disproportionately higher percentage of women in junior grades and therefore paid the lowest hourly rates comprise 45% of the women’s full pay dataset for running pay gap calculations. A consequence of the high proportion of the AA/AO/EO work groups made up of women depresses the mean hourly pay of the full women’s dataset. In contrast the far fewer men in these grades relative to the total headcount of the men dataset increases the mean hourly pay of men. The average salary values that are used for calculating 2021 hourly pay are:
- £39,713 for women
- £44,649 for men.
The 2021 mean pay gap calculation are shown below by grade at figure 7. Note the disparity between these pay gap figures and the 11.3% reported for the CPS.
Figure 7
| Mean Pay Gap | |
|---|---|
| AA/AO | 0.8% |
| EO | 0.4% |
| HEO/SEO | -0.7% |
| Grade 7/6 | 3.5% |
| SCS | 6% |
20. The slight narrowing in the 2021 mean pay gap figure (down 0.4 of a % point) is likely attributed to a combination of:
- 218 women recruited into G6/G7 roles compared to 163 men joining these grades. Allowing for attrition, G6/7 headcount increased by 141 (8.9%) women and 88 (8.4%) men since 2020.
- 255 women recruited into the EO grade compared to 101 men. Allowing for attrition, EO headcount increased by 98 (11.2%) women and 36 (10.6%) men since 2020.
21. The effect of G6/7 women recruitment, though positive news, is limited because inclusion of these higher hourly salaries into the women’s dataset are again diluted by the overall number of women employed in the most junior grades with low averaged hourly rates. In 2021, women headcount for the AA/AO grades increased by 8.9% compared to 4.3% for men. Women AA/AO grades comprise 15.8% of the workforce where men in AA/AO grades make up 5.7% of the workforce.
22. CPS has a strong employer brand that may appeal to those with caring responsibilities. It is well publicised that most caring responsibilities are shouldered by women, consequently this could be why CPS recruits more women than men, many of those into lower paid roles.
23. The annual analysis of CPS employee salaries by grade continues to show that men and women are paid broadly the same. Where variations do exist, in the main this continues to be explained by differences in the length of service at the same grade.
Bonus Gender Pay Gap
24. Bonus Pay Gap calculates the mean and median of the gender datasets by including only employees who received bonus pay over the last 12-month reference period. Omitting employees who did not have a bonus reduces the gender datasets significantly, which also means the calculations are sensitive to outliers. Figure 8 shows the CPS bonus pay gap, with figure 9 showing the percentage of men and the percentage of women who receive a bonus.
25. Bonus reporting relates to two CPS activities:
- Performance pay for the Senior Civil Service (SCS) and equivalent Senior Legal Manager (SLM) cadres, in line with Cabinet Office SCS Reward guidance on performance pay; and
- Corporate employee recognition and reward scheme of £25 flat rate eVouchers to recipients nominated by colleagues where the employee demonstrates corporate values and behaviours and going the extra mile when carrying out their work.
Bonus pay gap reported for 2020 is shown in brackets for comparison:
Figure 8
| Calculating Average | Mean | Median |
|---|---|---|
| Bonus Gender Pay Gap | -16.2% (-1.20%) | 0.0% (0.0%) |
Figure 9
| Proportion of men receiving a bonus | 41.3% (33.2.%) | 934 recipients (698) |
|---|---|---|
| Proportion of women receiving a bonus | 39.3% (32.7%) | 1773 recipients (1337) |
Median Bonus Pay Gap
26. There is 0% median bonus gap because the median value of both gender bonus datasets is £25 (value of a voucher award). This is because the majority of bonus payments relate to the flat rate vouchers referred to in paragraph 24.
Mean Bonus Pay Gap
27. The proportion of men and women receiving a bonus payment for 2021 increased compared to last year’s bonus pay gap and is broadly comparable (a difference of 2%). However, CPS identifies a significant pay gap that widened on last year’s negative bonus pay gap, where women averaged higher bonus pay compared to average bonus pay to men.
28. Analysis confirms this is attributed to the distribution of payments in the SCS/SLM cadre where individual payments are high value (£thousands) and far exceeding the £25 voucher awarded employees below SCS/SLM grades. Further, there is a disproportionately higher headcount of women SCS/SLM receiving bonus pay compared to men SCS/SLM. The ratio of SCS/SLM bonus payments between women and men remains at 2:1, with awards paid to women averaging 50% higher than the bonus awards to men in 2021.
29. As the size of SCS/SLM bonuses are outliers influencing each dataset, and that women SCS/SLM are receiving proportionately more PRP than their male SCS/SLM and at higher values, this results in the negative bonus gap.
Pay Quartiles
30. Figure 10 shows the proportion of male and female employees in each quartile with 2020 figures in brackets for comparison.
Figure 10
| Lower quartile | Lower middle quartile | Upper middle quartile | Upper quartile | ||||
|---|---|---|---|---|---|---|---|
| Men % |
Women % |
Men % |
Women % |
Men % |
Women % |
Men % |
Women % |
| 27.7 (26.7) |
72.3 (73.3) |
29.5 (30.4) |
70.5 (69.6) |
34.0 (35.1) |
66.0 (64.9) |
43.2 (43.7) |
56.8 (56.3) |
31. Women continue to be the prevalent gender headcount in each quartile, in line with the overall composition of the workforce. Minor increases in the proportion of women in the upper middle and upper quartiles reflects more women within the senior management grades. However, as clarified in the analysis above, it is the disproportionate concentration of woman in the junior grades/lower paid roles which continues to impact negatively on the CPS’ overall gender pay gap figure.
Work on narrowing the gender pay gap
32. The CPS gender ratio continues to remain at approximately 2:1 women to men, with 45% of female employees in the most junior grades (AA to EO). Consequently, to help narrow the pay gap CPS’ efforts continue to focus on ensuring there are no perceived barriers for women in these grades to move into more senior/leadership roles.
33. Through various talent management and management development programmes, together with identifying and eliminating potential barriers to career progression, CPS aspires to increase support for women in junior roles to progress into more senior posts. (Note these programmes are also available for male employees.) While there is evidence demonstrating these interventions are successful in their outcomes, the volume of women recruited into the junior grades AA to EO continues to offset any gain related to narrowing gender pay gap data achieved from these career development initiatives.
34. The CPS undertakes its annual Pay Analysis which compares the mean and median salary by grade for those in specific protected characteristics groups so that any disparities can be identified and addressed. The information feeds into the CPS’ Annual Equalities Report and it also informs the pay strategies.
35. The 2021 Pay Analysis does not identify any major areas of concern across CPS pay and pay related practices. However, as identified in previous years, there continues to be an under- representation of women in the Crown Advocate grades (G7 equivalent), currently 42%. Whilst this remains disproportionate compared to the overall representation of women in the CPS, it demonstrates progress from the 2020 analysis where the proportion of women Crown Advocates stood at 36%. Effective actions include appointment of the gender champion and the development of a positive action campaign.
Recruitment, retaining and developing an inclusive workforce
36. Recruitment activity is ‘internal’ (applications limited to existing CPS employees only) or ‘external’ (open to existing employees, the wider civil service, and the general public). During 2020/21 females accounted for almost 65% of all appointments (internal and external). For junior grades AA to SEO, women appointments accounted for 50% of all external and internal recruitment, compared to 21% for men recruited into these grades. These statistics are consistent with the 2019/20 reference period and broadly align with the overall gender composition of CPS (66% women).
37. CPS recruitment complies with the CS Commissioners Recruitment Principles that ensure appointments are on merit following fair and open competition. To safeguard against bias at shortlisting stage of the selection process the CPS recruitment procedure follows an approach where each application submitted is name and gender blind/ anonymised.
38. All panel members must complete the CPS recruitment e-learning modules covering equality, diversity and inclusion and its application in recruitment, unconscious bias, and it is also mandatory for panel members to attend a Success Profiles training session.
Family friendly Practices and Benefits
39. CPS has a proven track record of flexible working. CPS has been recognised by Working Families as a top ten employer for the last four years, which assesses against four key measurements -
- Integration to organisational strategy and culture
- Policy
- Consistent practice
- Evidence and statistics
In 2020/21, 23% of CPS employees work part time (any work pattern which amounts to less than 37 hours per week), of which 89% are women.
40. The Future Working project has gathered greater insight into how the business worked during the pandemic and adapted as employees worked in different ways. This insight has shaped our future ways of working as we move to a more hybrid system. The programme is looking into how CPS incorporates what has been learned to shape the future ways of working. The focus of the programme remains its employees and aims to ensure it has a supported and looked-after its workforce offering optimum flexibility and the right tools to meet on-going business commitments.
41. The CPS remains committed to supporting staff who have caring responsibilities and following the introduction of the Carers Network has now launched a new subgroup, the ‘Carers for Children Network’. The aim of the new network is to support parents and carers of children of any age who have disabilities, difficulties or are neuro atypical. Having achieved a Level 2 Carers Accreditation by Employers for Carers UK this recognises CPS’ collective efforts to build an inclusive workplace where carers are recognised, respected, and supported.
Career paths
42. CPS offers a variety of opportunities to assist employees in all grades with career progression. For example, throughout the period 2019 to 2021, CPS offered a portfolio of 18 different apprenticeship schemes, which included a total 512 participants. Business and Administration and Public Service Operational Delivery apprentices make up over half of all participants. New joiners to CPS may begin their career as temporary A2 apprentices and have opportunities to gain permanent employment and further development opportunities. In addition to the A2 apprenticeship programme, further apprenticeship schemes are targeted towards specific skills and areas of the business, offering apprentice qualifications at levels 3 to 7 across Finance, HR, Management and Leadership, and Project Management roles amongst others.
43. The Prosecutor Pathways offers a unique opportunity to build upon academic and professional qualifications through sponsored study towards becoming a Crown Prosecutor whilst continuing in the security of your current role. The Legal Trainee and Solicitor apprentice scheme female intake for 2019 was 64.3%, which broadly aligns to the overall composition of CPS, for 2020 has seen an increase to 72% of participants who are women. This is a positive outcome which indicates CPS initiatives to encourage women into more senior roles is having an impact.
44. Further work continues to identify and remove any barriers for female employees moving into more senior roles. The CPS Gender Champion has worked with Women in The Law UK to promote:
- The CPS 6-point plan including the Advocacy Strategy and the development of the monitoring tool.
- What Chambers should be doing and the level of diversity at the Bar, and Bar Council initiatives.
Pay systems
45. The 2020 pay settlement continued the longer-term pay strategy which implemented significant reductions in several of the lengthier pay ranges. This has facilitated less variation in the way salaries are positioned along the range.
46. During 2021/22 pay pause, the government guidance on pay permits small increases for those with a salary under £24,000 per annum. Due to the composition of the CPS workforce, and a high proportion of female employees in Level A grades, this is likely to affect the mean pay gap for the 2022 snapshot report.
Declaration
47. The CPS confirms that the reported data is accurate and has been calculated according to the requirements and methodology set out in the Equality Act 2010 (Specific Duties and Public Authorities) Regulations 2017.
Dawn Brodrick, Chief People Officer
Crown Prosecution Service, March 2022