
Staff report
Our employees in numbers (audited)
The average number of full-time equivalent (FTE) employees paid during the year was 7,570 (2024-25: 7,291).
| 2025-26 | 2024-25 |
|---|---|---|
Payroll employed staff | 7,287 | 7,039 |
Non payroll staff | 283 | 252 |
Total | 7,570 | 7,291 |
The table below shows number of senior staff at 31 March 2026. This includes both permanent and fixed term contracts.
2025-26
2024-25
Headcount
FTE
Headcount
FTE
G1 Perm Sec
1
1
1
1
SCS3
2
2
1
1
SCS2
7
7
6
6
SCS1
27
27
18
18
SLM2
22
21
21
20
SLM1
45
44
51
50
Total senior civil servants
104
102
98
96
Non-SCS
8.288
7,768
7,500
7,002
Total
8,392
7,870
7,598
7,098
Our employee costs (audited)
Permanently employed staff
£000Others
£0002025-26
Total
£0002024-25
total
£000Wages and salaries
380,612
9,680
390,292
357,679
Social security costs
53,631
-
53,631
40,494
Other pension costs
102,897
-
102,897
95,686
Total staff costs
537,140
9,680
546,820
493,859
Less: recoveries outward secondments
(216)
-
(216)
(307)
Total net costs
536,924
9,680
546,604
493,552
Further details of staff costs can be found in Note 3 to the Accounts.
Our workforce composition
The following statistics provide a snapshot of our workforce. They help us understand how representative we are and where we need to focus our attention, as we continue to build a fair and inclusive work environment and a workforce that at every level, reflects the diverse communities we serve. The tables and charts below show the breakdown of our employees as at 31 March 2026.
Breakdown of employees by gender
2025-26
2024-25
2023-24
2022-23
2021-22
Male
Female
Male
Female
Male
Female
Male
Female
Male
Female
Senior managers (Senior civil servants and senior legal managers)
43%
57%
39%
61%
43%
57%
45%
55%
42%
58%
Other employees
31%
69%
32%
68%
32%
68%
33%
67%
33%
67%
Total employees
30%
70%
32%
68%
32%
68%
33%
67%
33%
67%
Breakdown of employees by ethnicity
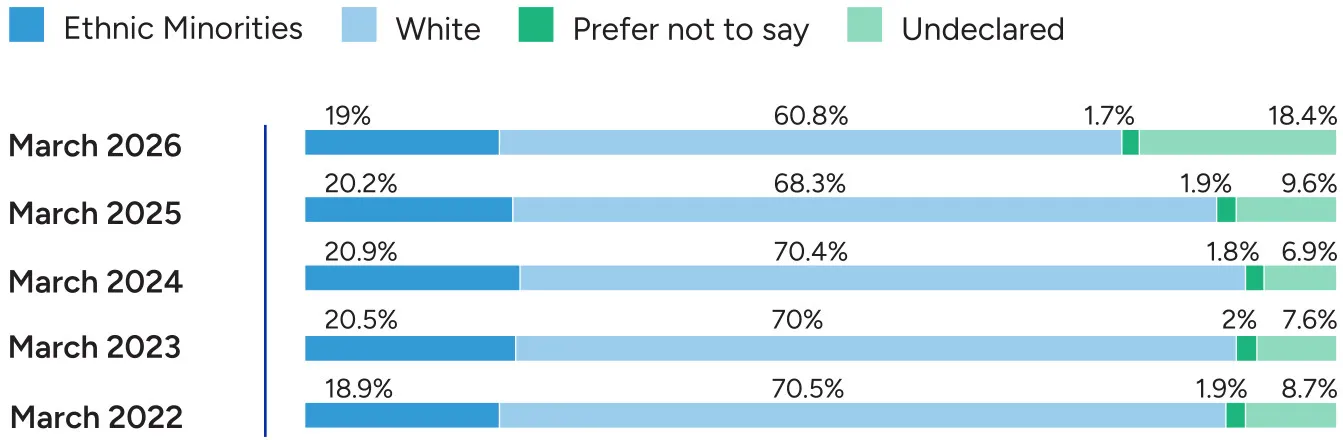
Ethnic Minorities | White | Prefer not to say | Undeclared | |
|---|---|---|---|---|
| March 2026 | 19% | 60.8% | 1.7% | 18.4% |
| March 2025 | 20.2% | 68.3% | 1.9% | 9.6% |
| March 2024 | 20.9% | 70.4% | 1.8% | 6.9% |
| March 2023 | 20.5% | 70% | 2% | 7.6% |
| March 2022 | 18.9% | 70.5% | 1.9% | 8.7% |
Breakdown of employees by disability
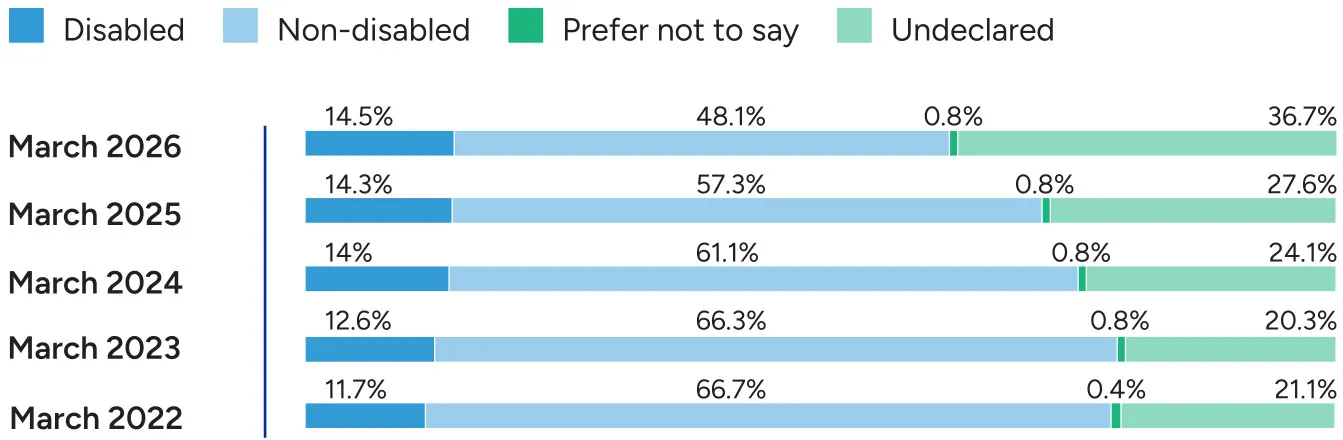
Disabled | Non-disabled | Prefer not to say | Undeclared | |
|---|---|---|---|---|
| March 2026 | 14.5% | 48.1% | 0.8% | 36.7% |
| March 2025 | 14.3% | 57.3% | 0.8% | 27.6% |
| March 2024 | 14% | 61.1% | 0.8% | 24.1% |
| March 2023 | 12.6% | 66.3% | 0.8% | 20.3% |
| March 2022 | 11.7% | 66.7% | 0.4% | 21.1% |
Breakdown of employees by sexual orientation
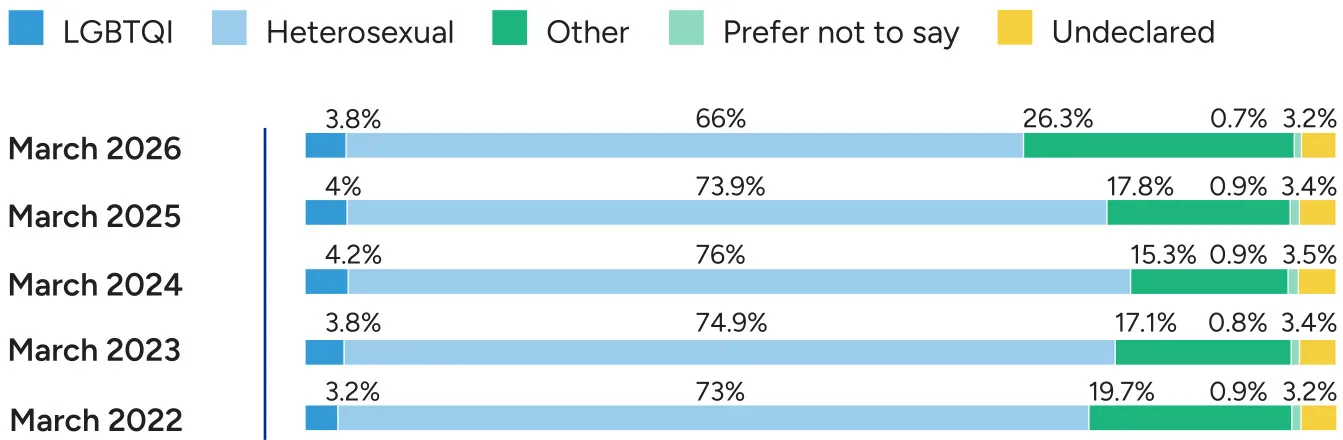
LGBTQI | Heterosexual | Other | Prefer not to say | Undeclared | |
|---|---|---|---|---|---|
| March 2026 | 3.8% | 66% | 26.3% | 0.7% | 3.2% |
| March 2025 | 4% | 73.9% | 17.8% | 0.9% | 3.24 |
| March 2024 | 4.2% | 76% | 15.3% | 0.9% | 3.5% |
| March 2023 | 3.8% | 74.9% | 17.1% | 0.8% | 3.4% |
| March 2022 | 3.2% | 73% | 19.7% | 0.9% | 3.2% |
Diversity and inclusion
In line with the Public Sector Equality Duty, the Crown Prosecution Service has due regard to the need to eliminate discrimination, advance equality of opportunity and foster good relations. This underpins our approach to being a fair, diverse and inclusive employer, reflecting the public we serve and supporting our people to thrive at work. We continue to make progress through our recruitment and workforce development activity and by promoting an inclusive and supportive working environment.
Our representation of women across most grades, including within the Senior Civil Service, is above the Civil Service average, and our ethnic minority representation compares favourably with the Civil Service as a whole. Our work on diversity, equality and inclusion has been recognised externally, including through Disability Confident Leader accreditation and recognition by Working Families as a Top 10 Employer for eight consecutive years
Building on reviews undertaken in 2023-24 into progression to senior roles for ethnic minority colleagues and the recruitment experience of ethnic minority and disabled candidates, we continue to embed and deliver the recommended actions. This activity is focused on improving progression, recruitment practices and the experience of these groups.
Through our commitments under the Disproportionality Action Plan, we continue to strengthen our approach to addressing race disproportionality. This includes equipping our people with the skills and confidence to identify and challenge racial bias in decision-making and taking action to address disproportionality across the criminal justice system, in support of fairness and public confidence.
Gender
We support gender equality through transparent gender pay gap reporting, targeted pay and progression action, and structured interventions such as the Crossing Thresholds programme to support progression for women at junior grades, alongside the maintenance of robust family-friendly policies including enhanced maternity, parental and special leave. Flexible and hybrid working are consistently positioned as core equality levers, reinforced through senior leadership visibility, International Women’s Day activity, and evidence-led communications.
Ethnicity
19% of CPS staff declare ethnic minority backgrounds, (rising to 24% when measured under Civil Service criteria). We have taken targeted action to advance racial equality by addressing barriers to progression for ethnic minority staff, including delivery of the Glass Ceiling Pathway, ringfencing places on senior leadership programmes such as Beyond Boundaries, and providing access to tailored coaching and development support.
These actions were underpinned by stronger transparency and accountability through the Annual Equalities in Employment Report, the Ethnicity Pay Gap Action Plan, improved workforce data via the Count Me In declaration campaign, and regular monitoring through the Disproportionality Programme. CPS also reinforced its commitment to becoming an anti-racist organisation by publishing an Anti-Racist Statement, investing in and partnering with staff networks such as the National Black Crown Prosecution Association, and strengthening inclusive recruitment practices to widen access to opportunities across the organisation.
Age
With 51% of the CPS workforce over the age of 45, we are increasingly focused on age as an important factor in workplace equity. We prioritise flexible working, support for carers and inclusive development. We seek to support retention, progression and a fair workplace experience across the working life cycle. We offer these same benefits to younger workers that helps cultivate a workplace culture that appeals to and retains the next generation of workers.
Sexual orientation and gender identity
We continue to foster a supportive and inclusive working environment for LGBT+ colleagues, underpinned by strong staff networks, visible allyship and clear organisational standards on dignity and respect. Engagement and inclusion scores for many LGBT+ staff remain broadly positive, reflecting the value of safe communities, active leadership support and opportunities to bring lived experience into organisational learning. Through evidence-led workforce analysis and ongoing collaboration with our LGBTi Employee Network, the CPS is strengthening understanding of where inclusion works well and where further action is needed to ensure equitable experiences for all.
Socio-economic background
Previously recognised as one of the Top 75 employers in the Social Mobility Foundation’s Employer Index, the CPS has continued to strengthen socio-economic inclusion through coordinated action, including work to increase declaration, deeper People Survey analysis, and active leadership from the CPS Social Mobility Champion working alongside the Social Mobility Network. This activity has improved data quality and supported positive progress in engagement and inclusion for colleagues from lower socio-economic backgrounds. Together, these actions reflect an ongoing, evidence-led commitment to fairness and opportunity, supporting CPS 2030 by helping our people feel valued and able to thrive, regardless of background.
Disability
We continue to support staff with disabilities and long-term health conditions, shining a spotlight on all types of disability, including those that are invisible, working hard to promote a greater awareness and understanding of these conditions.
We have seen an increase in disability representation at 14% in 2023-24 rising to 14.5% in 2025-26 linked to:
- Using evidence to target improvement; using workforce and People Survey insight to identify and address disparities in engagement, dignity and respect at work.
- Implementing disability-related case studies into learning and development interventions and investing in manager capability to enable confident, practical and inclusive decision making.
- Improving how workplace adjustments are agreed and reviewed to ensure support is timely and focused on barrier removal.
- Enhanced access to specialist advice, including Digital Accessibility Services, Occupational Health and external disability inclusion expertise.
- Updating disability language within the Oracle HR Platform
- Piloting ‘questions in advance of interview’ for operational grades to improve accessibility within recruitment practices
- Updating recruitment guidance to affirm the need for diverse and inclusive practice
Principal Civil Service Pension Scheme
The Principal Civil Service Pension Scheme (PCSPS) and the Civil Servants and Other Pensions Scheme (CSOPS) – known as ‘alpha’ – are unfunded multi-employer defined benefit schemes in which we are unable to identify our share of the underlying assets and liabilities.
The scheme actuary valued the PCSPS as at 31 March 2020. Details can be found in the resource accounts of the Cabinet Office: Civil Superannuation (csps2022-prod.azurewebsites.net/knowledge-centre/resources/resource-accounts and www.gov.uk/government/publications/civil-superannuation-annual-account-2024-to-2025).
For 2025-26, employers’ contributions of £102,283,181 were payable to the PCSPS (2024-25: £95,162,753) at 28.97% of pensionable pay, based on salary bands.
The Scheme Actuary reviews employer contributions usually every four years following a full scheme valuation. The contribution rates are set to meet the cost of the benefits accruing during 2024-25 to be paid when the member retires and not the benefits paid during this period to existing pensioners.
Employees can opt to open a partnership pension account, a stakeholder pension with an employer contribution. Employers’ contributions of £591,536.84 (2024-25: £505,062) were paid to one appointed stakeholder pension provider Legal and General. Employer contributions are age-related and ranged from 8% to 14.75% (2024-25: 8% to 14.75%) of pensionable pay. Employers also match employee contributions up to 3% of pensionable pay. In addition, employer contributions of £22,728 at 0.5% (2024-25: £19,075, 0.5%) of pensionable pay were payable to the PCSPS to cover the cost of the future provision of lump sum benefits on death in service or ill health retirement of these employees.
Contributions due to the partnership pension providers at the reporting period date were £56,163 (2024-25: £42,270 ). Contributions prepaid at that date were nil (2024-25: nil).
Nine individuals (2024-25: 10) retired early on ill- health grounds; the total additional accrued pension liabilities in the year amounted to £139,641 (2024-25: £226,809).
Staff engagement
The annual Civil Service People Survey looks at civil servants’ attitudes to, and experience of working in the Civil Service.
Our response rate this year was 44% (2024: 46%) and our Employee Engagement Index (EEI) was 68% (2024: 65%). The EEI is the average positive responses to five key questions around people’s personal attachment to CPS, striving in the work they do, and speaking positively about working here.
You can find the mean scores by organisation for each question in the published Annual Civil Service People Survey Benchmark Results at www.gov.uk/government/collections/civil-service-people-surveys
Expenditure on temporary staff
| 2025-26 | 2024-25 |
|---|---|---|
Expenditure on temporary staff | 9,497 | 6,625 |
Expenditure on consultancy
2025-26
£0002024-25
£000Expenditure on consultancy
294
660
Consultancy expenditure is reported on a resource basis using accounting data underlying the Financial Statements. This is consistent with the expenditure figures reported in Note 3.
Sickness absence
The table below details the average work days lost in CPS for the past five financial years.
2025 -26
2024-25
2023-24
2022-23
2021-22
Average working days lost 7.9
8.8
8.0
8.0
7.3
Average working days lost has decreased significantly over FY25-26, from 8.8 to 7.9 at Q4, against a Civil Service average of 8.4.
Staff turnover
The table below details our turnover percentage for the past five financial years.
2025-26
2024-25
2023-24
2022-23
2021-22
Staff turnover
7.5%
8.6%
9.1%
8.1%
7.6%
Staff turnover is currently at its lowest level since mid-FY22-23, reducing through FY25-26 from 8.6% to 7.5% at Q4.
Reporting of Civil Service and other compensation schemes – exit packages (audited)
The table below shows exit packages:
2025-26
2024-25
Exit package cost band
Number of compulsory redundancies
Number of other departures agreed
Total number of exit packages
Number of compulsory redundancies
Number of other departures agreed
Total number of exit packages
< £10,000
-
4
4
-
4
4
£10,000 – £25,000
-
1
1
-
4
4
£25,000 – £50,000
-
6
6
-
2
2
£50,000 – £100,000
-
4
4
-
7
7
£100,000 – £150,000
-
7
7
-
7
7
£150,000 – £200,000
-
-
-
-
1
1
Total number of exit packages
-
22
22
-
25
25
Total cost of exit packages (£000)
-
1,415
1,415
-
1,598
1,598
Redundancy and other departure costs have been paid in accordance with the provisions of the Civil Service Compensation Scheme, a statutory scheme made under the Superannuation Act 1972.
Exit costs are accounted for in full in the year the departure is agreed. Where we have agreed early retirements, the additional costs are met by us and not by the Civil Service pension scheme.
Ill-health retirement costs are met by the pension scheme and are not included in the table.
Off payroll engagements
Table 1: Highly paid off-payroll worker engagements as at 31 March 2026, earning £245 per day or greater
Total
Number of existing engagements as of 31 March 2026
26
Of which, number that existed:
for less than one year
23
for between one and two years
1
for between two and three years
1
for between three and four years
1
for four or more years
0
Table 2: Highly paid off-payroll workers engaged at any point during the year ended 31 March 2026, earning £245 per day or greater
Number of temporary off-payroll workers engaged during the year ended 31 March 2026
38
Of which:
Not subject to off-payroll legislation1
0
Subject to off-payroll legislation and determined as in-scope of IR35
36
Subject to off-payroll legislation and determined as out-of-scope of IR35
2
Number of engagements reassessed for compliance or assurance purposes during the year
16
Of which: number of engagements that saw a change to IR35 status following review
0
Table 3: For any off-payroll engagements of board members, and/or, senior officials with significant financial responsibility, between 1 April 2025 and 31 March 2026
Number of off-payroll engagements of board members and/or senior officials with significant financial responsibility during the financial year
0
Total number of individuals on-payroll and off-payroll that have been deemed “board members and/or senior officials with significant financial responsibility” during the financial year
0
A worker that provided their services through their own limited company or another type of intermediary to the client will be subject to off-payroll legislation and the department must undertake an assessment to determine whether that worker is in-scope of Intermediaries legislation (IR35) or out-of-scope for tax purposes.